
I have written a post in which I explained Machine Learning in simple words. You can find the post here.
Heart of the Machine Learning is the bunch of Algorithms. Algorithm plays very important role in creating the models. Nowadays different languages like Python, R and different tools like Azure, AWS has made our life so easy if we want to create Machine Learning projects.
But one should understand the algorithm instead of just using pre-existing libraries which above languages have already created.
In this article, I will try to explain Linear Regression.
Let us go back to our school days. You might remember syntax:
Y = MX + B
where:
- B is the intercept,
- M is the Slope, can be positive or negative
- X is Independent variable
- Y is dependent variable
So if you have X, you can figure out what Y is.
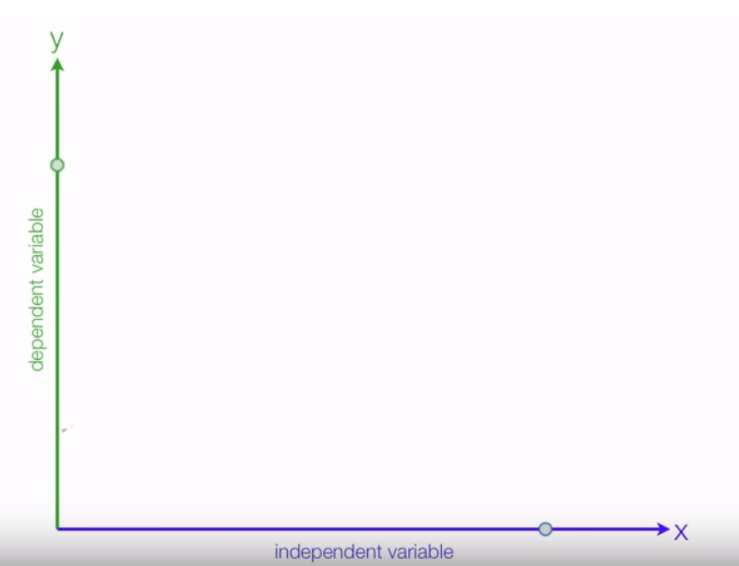
In simple words “Linear Regression” is a method to predict dependent variable (Y) based on values of independent variables (X).
Situation 1:
If X increases and Y also increases, it is called positive relation:
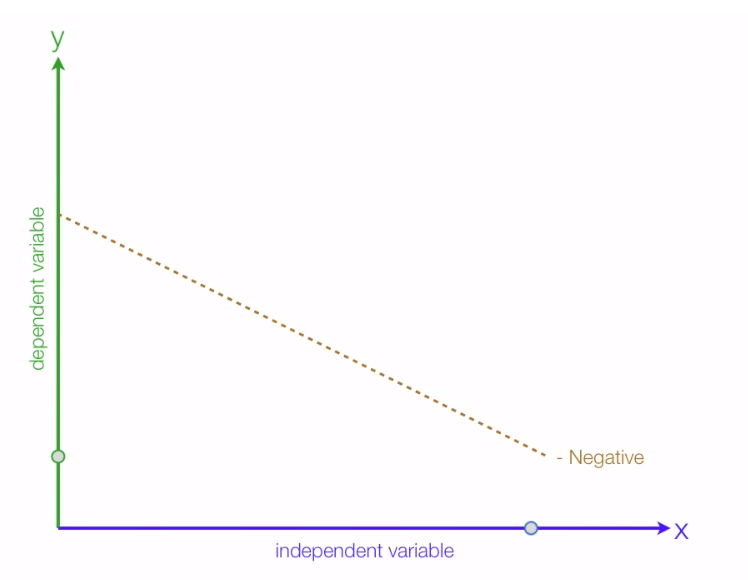
Situation B:
If X increases but Y decreases, it is called negative relation:
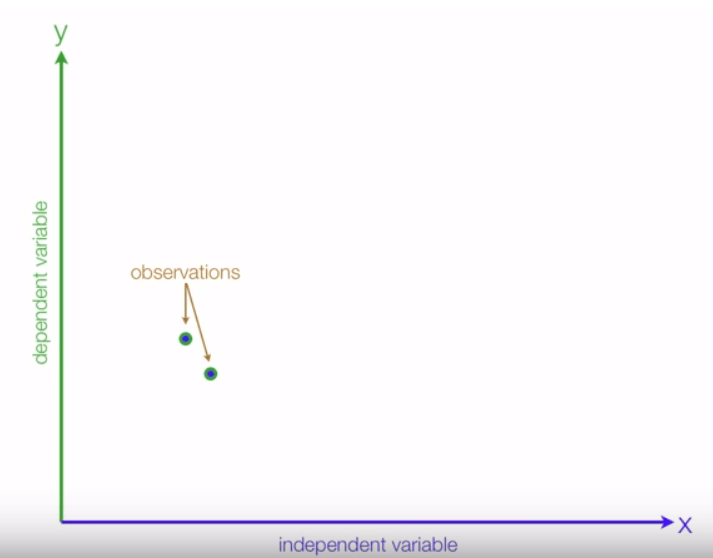
Let us see how to create a regression line:
To conduct regression, we require different observation. We can put those observations between X and Y:
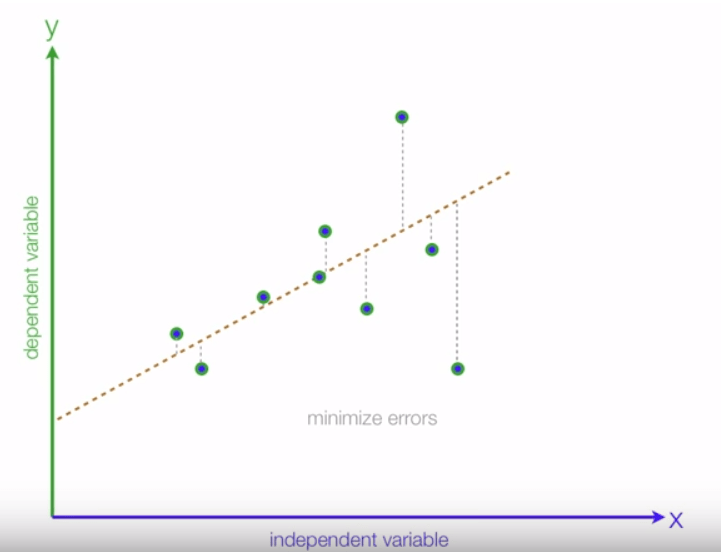
Once all the observations are placed correctly, we can create the line which will fit all those observation dots and this is called the Regression line:

As we know, all the observation would never be in the straight line, there is always a difference between estimated value and an actual value. In the end, we are required to minimize the difference between estimated value and an actual value. We will call this difference as errors:
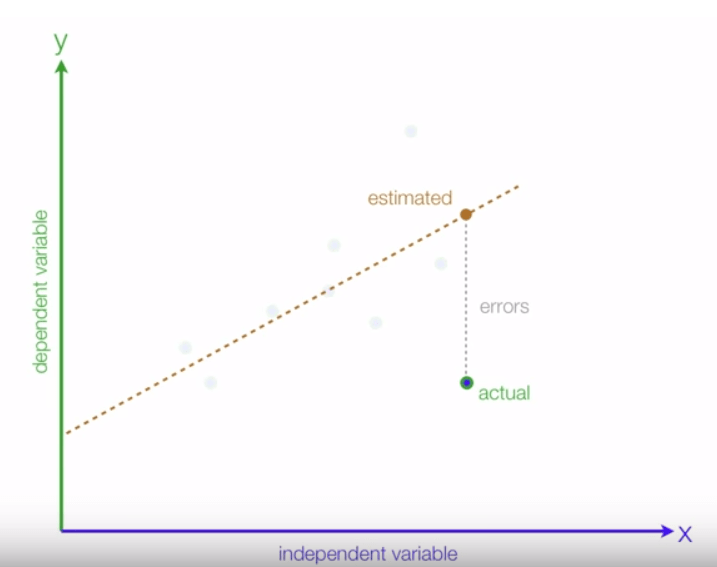
We would target to minimize these errors and above line has many errors when we compare actual with estimated values:
Let us take some examples to understand the Positive relationship and Negative relationship.
For example, if we study more our grades would increase:
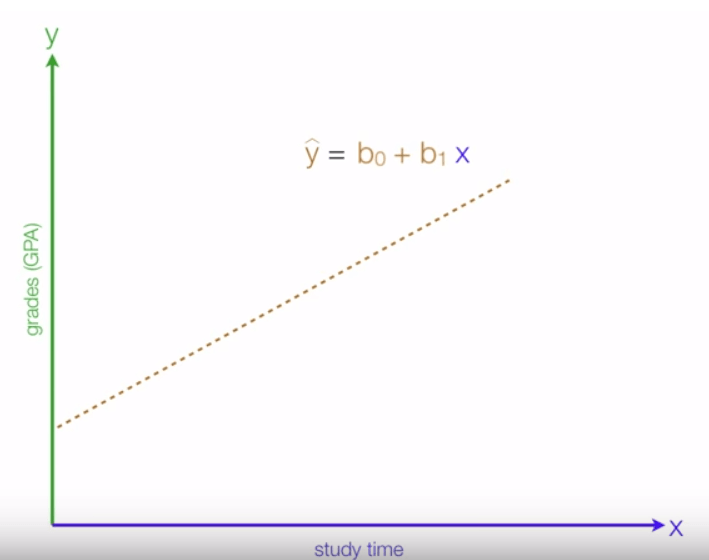
It is a positive relationship where:
- y is estimated grades
- x is study time
- b0, we can derive mathematically and it is the y interceptor
- b1, this can also be derived mathematically, it is the slope
In simple words, if your study time is 0, grades are 10% and if you increase study time by 10 hours, grades would be greater than 10% and grades can be counted using above syntax.
Though there might be lot other features which affect the grades, for simplicity, we have only considered study time as the only feature. This is also called Univariate Linear Regression.
Multiple Linear Regression
We can increase our feature set by selecting more parameters like IQ of the person, the interest in the subject etc. For example, we can plot the grades against the interest of the person in particular subject and study time on a single graph, where the vertical axis plots grades and the two horizontal axes the interest in the subject and study time:
In this case, we can again fit a predictor to the data. But instead of drawing a line through the data we have to draw a plane through the data because the function that best predicts the grades is a function of two variables.
Now, let us see the Negative relationship:
If you spend more time on Facebook, grades would decrease:
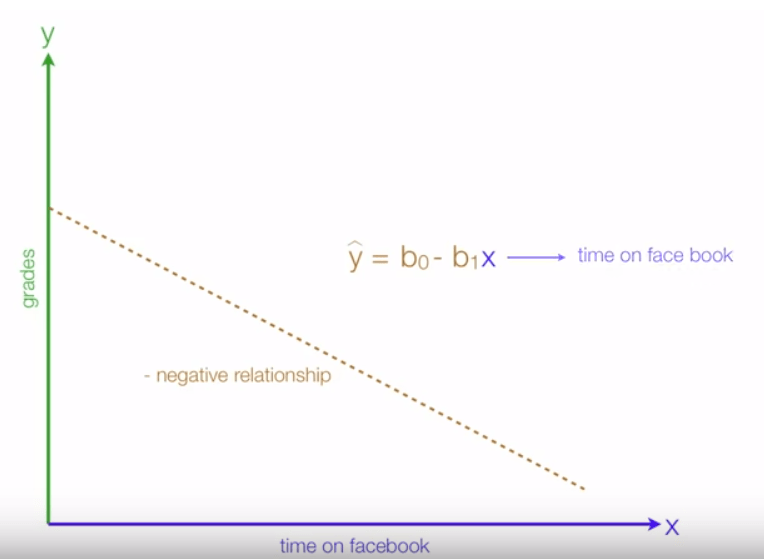
As you can see above, if x increases, it would be multiplied by -b1(slope). Thus y decreases.
X is a dependent variable which we can manipulate, control, change and Y is a dependent variable which is nothing but the outcome of X’s activity.
Let us see some calculation of Study example:
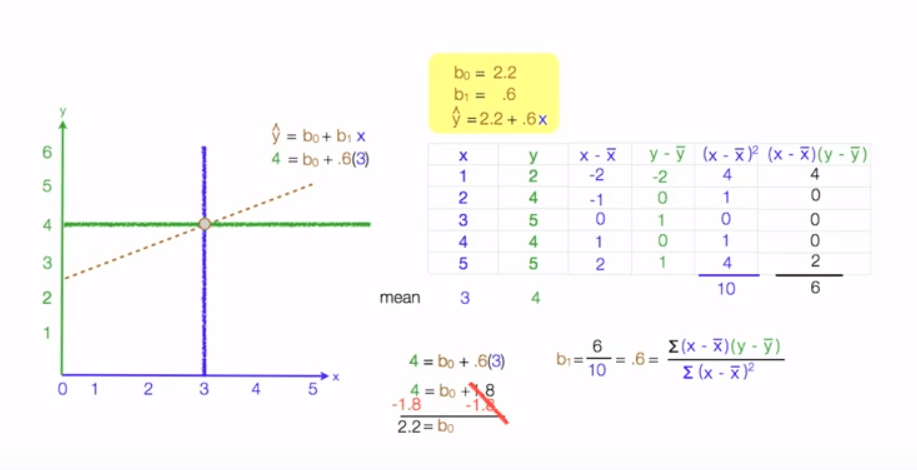
Hope it helps.
